empirical and theoretical cases
There's a simple difference between empirical and theoretical cases: empirical are observed experimental values whereas theoretical are assumed values. This just means that if you're finding the probability of getting heads n times when flipping a coin 10 times you'd be looking at a symmetrical graph in a theoretical case and a skewed graph in an empirical case. Using both can be helpful when proving the effectiveness of a case. For example, if you begin an experiment believing you have, theoretically, a 50% chance of success then conduct the experiment and find the empirical probability is closer to 30% you may now have to look at any factors in your experiment that you didn't account for that may have skewed your results.
normal bell curve
The normal bell curve is effective in many cases but for situations where results are skewed or not perfectly symmetrical (as is typical of empirical cases) the normal bell curve isn't effective.
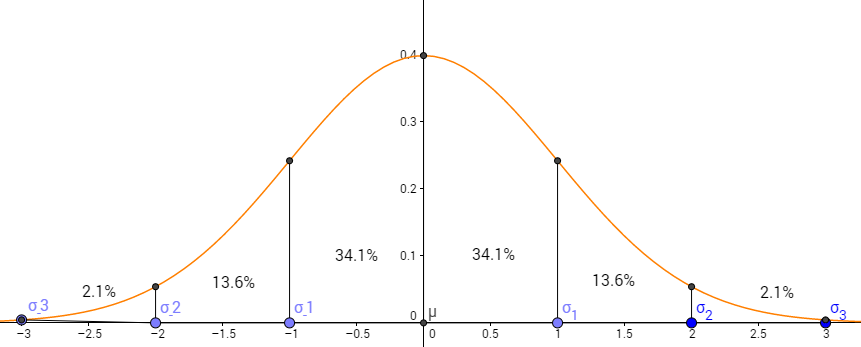
This visual I created on Geogebra demonstrates my increased knowledge of probability and the functions of the normal bell curve as well as my enhanced capabilities in using the resource Geogebra.
The normal distribution curve is an easy way to visualize the probability of an event occurring the further it gets away from the average value or mean. The sigma, or standard deviation, located on the x-axis increase the further away they are from the mean. Inversely, the area within the curve is decreased as sigma increases. With this concept in mind, finding the probability of values that aren't a perfect standard deviation away is possible with the help of your calculator! We use Normalpdf and Normalcdf to calculate exact values or all values up to or between specific points.
binomial?
A situation is binomial if it meets the following criteria:
1. The procedure has a fixed number of trials. [n trials]
2. The trials must be independent.
3. Each trial is in one of two mutually exclusive categories (independent).
4. The probabilities remain constant for each trial.
An example would be getting either odd or even numbers when you roll the die 10 times. You could say that a success would be odd numbers and a failure even numbers (this is not to say odds are better than evens). The fixed number of trials would be 10; the trials are independent as the results of one have no impact on the next; you can't be both odd and even so the outcomes are mutually exclusive, and the probability of rolling odd or even is 50% each time.
Once you've made sure you are dealing with a binomial situation you can make a probability distribution table to find your expected value or histogram to visually represent probabilities. A probability distribution is a table composed of possible outcomes and their corresponding probabilities. For example, if you're making a probability distribution for gaining a dollar every time you flip heads on a coin and lose a dollar every time you flip tails.
x $1 -$1
P(x) .5 .5
A probability histogram is the visual representation of the probability of a success occurring x amount of times with a given n value.
